Understanding numbers becomes simple when you know the mean equation. The mean is the most common way to find an average of a set of numbers. Students, teachers, and professionals use it in statistics, business, and daily life to make sense of data.
The mean equation shows how to add all numbers and divide by the total count. It works for school problems, survey data, salaries, and even Excel calculations.
Using a step-by-step mean calculation helps you understand statistical averages clearly.
In this article, you will learn:
- Arithmetic mean equation
- Weighted mean equation
- Geometric mean equation
- Harmonic mean equation
- Population and sample mean equations
- How to calculate mean in Excel
- Standard error of the mean equation and more
We will also show solved mean problems, sample mean equation examples, and real-life applications to make learning easy and fun.
What Is the Mean Equation?
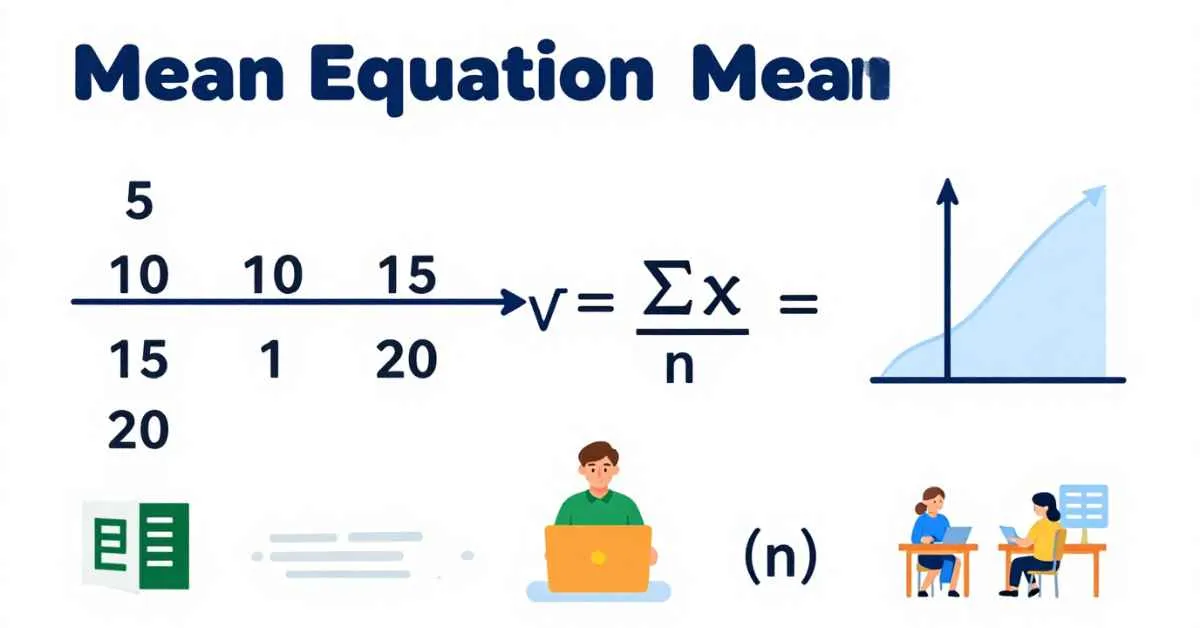
The mean equation finds the center of a data set. It is also called the average. The formula for the arithmetic mean equation is simple:
x̄ = ∑x / n
Where:
- x̄ (x-bar symbol) = mean or average
- ∑x (sigma notation) = sum of all values
- n = number of values
This formula is the sample mean equation when using a part of the population and the population mean equation when using the entire dataset.
Other related formulas include:
- Weighted mean equation – when some numbers count more than others
- Geometric mean equation – useful for growth rates
- Harmonic mean equation – used for rates like speed or efficiency
How to Calculate Mean Step by Step
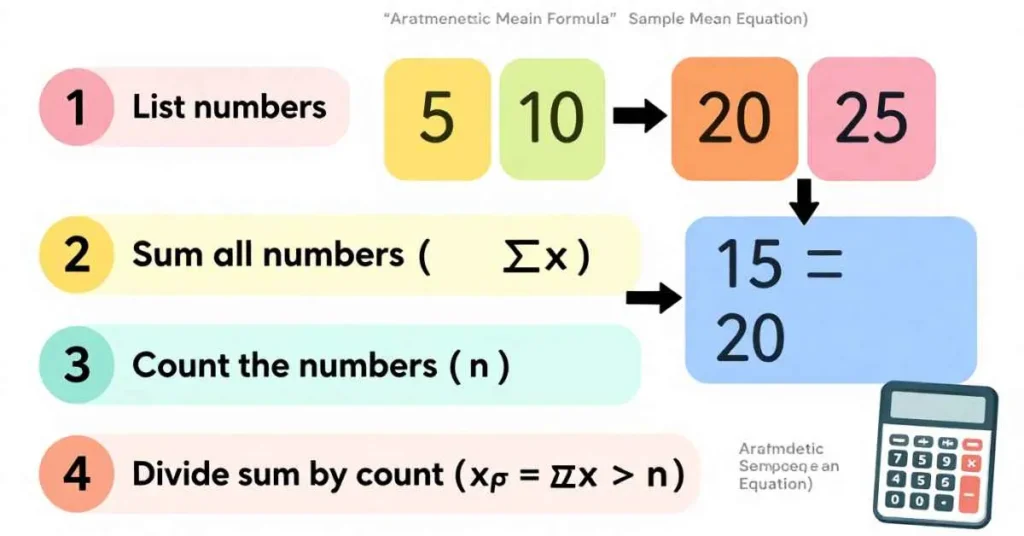
Follow these easy steps:
- List all numbers – Write every number in the dataset.
- Find the sum – Add all values (∑x).
- Count the numbers – Total count = n.
- Divide sum by count – Use the mean equation: x̄ = ∑x ÷ n.
Example 1: Simple Numbers
Numbers: 5, 10, 15
- Sum = 5 + 10 + 15 = 30
- Count = 3
- Mean = 30 ÷ 3 = 10
Example 2: Students’ Marks
Marks: 60, 70, 80, 90
- Sum = 300
- Count = 4
- Mean = 300 ÷ 4 = 75 (class average)
Real-Life Applications of the Mean Equation in Business and Science
The mean equation is not just a classroom tool—it is widely used in business, research, and science.
1. Business Data Analysis:
Companies use the mean equation to find the average salary, the average revenue, and other numbers that show how well they are doing. This helps them plan budgets, predict sales, and see how well employees are doing. In Excel, analysts use the mean equation Excel to calculate averages for large sets of numbers quickly.
2. Research and Surveys:
Researchers use the sample mean equation to find the average of survey answers. This helps them understand what people think or like. For example, finding the survey results average shows trends and makes it easier to report results.
3. Scientific Measurements:
Scientists use the population mean equation and the standard error of the mean equation to look at experiment results. The normal distribution mean equation helps them see what to expect and compare results.
4. Everyday Life Applications:
The mean equation helps in daily life too. It can find the class average, average marks, average speed, or average calories. It makes numbers easier to understand and helps people make good decisions.
Common Mistakes and Misconceptions About the Mean Equation
Many students and professionals use the mean equation, but mistakes are common. Understanding these errors helps prevent incorrect results.
- Counting Numbers Wrong:
Some people forget a number or count the numbers wrong. This makes the sample mean equation give the wrong answer. - Ignoring Very High or Low Numbers:
Very big or very small numbers, called outliers, can change the mean a lot. For example, one very high salary can make the mean salary calculation look bigger than most salaries. Sometimes, using the median or weighted mean equation is better. - Mixing Up Different Means:
Students can confuse different types of mean:
- Arithmetic mean = simple average
- Geometric mean = used for growth or percentages
- Harmonic mean = used for speeds or rates
- Using Wrong Excel Formulas:
In Excel, using=AVERAGE()for numbers that need weights can give wrong answers. People can also get confused between mean equation in Excel and grand mean equation.
By knowing these mistakes, you can use the mean equation correctly for school or real life.
Advanced Concepts: Linking Mean Equation to Probability and Statistical Analysis
Standard Deviation and Variance: The standard deviation of the mean equation uses the mean to see how far numbers are from the average. This helps with probability mean equation calculations and predicting trends.
Sample vs Population Mean: The sample mean equation uses a small part of the data to guess the whole. The population mean equation uses all the data. Knowing the difference helps with statistical analysis and normal distribution mean equation problems.
Grand Mean Equation: When you have many groups, the grand mean equation finds the average of all the groups together. Scientists use this in experiments and in analysis of variance (ANOVA) to compare groups.
Probability Applications: The mean equation helps find expected results and chances. It is important for probability calculations and for making decisions based on data.
Mean vs Median vs Mode
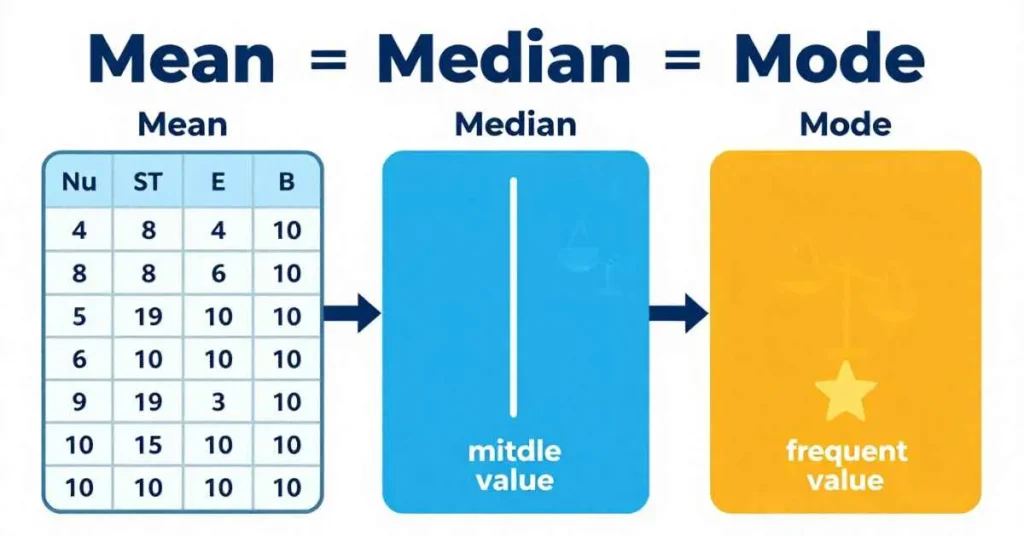
The mean equation is one way to measure central tendency, but median and mode are also important:
- Mean = average of all numbers (x̄ = ∑x / n)
- Median = middle value when numbers are ordered
- Mode = number that appears most often
The mean is sensitive to outliers, so sometimes the median is better.
Advanced Mean Equations
Weighted Mean Equation
Used when numbers have different importance.
Weighted mean = Σ(weight × value) ÷ Σ(weights)
Geometric Mean Equation
Useful for growth rates or percentages:
Geometric mean = (x₁ × x₂ × … × xn)^(1/n)
Harmonic Mean Equation
Used for rates like speed:
Harmonic mean = n ÷ Σ(1/xᵢ)
Standard Error of the Mean Equation
Shows how much the sample mean varies from the population:
SEM = s / √n
Where s = standard deviation of the sample, n = sample size.
Population Mean Equation
Calculates the mean of an entire population:
μ = ΣX / N
Mean Equation in Excel
You can calculate the mean easily in Excel using:
=AVERAGE(range)→ mean equation Excel=AVERAGE.WEIGHTED(range, weights)→ weighted mean- Works for class averages, business data analysis, or survey results average
Real-Life Uses of the Mean Equation
- Education – Calculate class average or average marks formula
- Business – Analyze sales, mean salary calculation, or revenue trends
- Research – Summarize survey results average
- Everyday Life – Average expenses, speed, or calories
Common Mistakes in Calculating Mean
- Forgetting values in the data set
- Dividing by wrong number of observations (n)
- Confusing mean with median or mode
- Arithmetic errors during sum calculation (∑x)
- Ignoring outliers
Practice Problems (With Answers)
- Numbers: 4, 8, 6, 10 → Mean = 7
- Marks: 65, 70, 75, 80, 90 → Mean = 76
- Daily sales: 12, 15, 18, 20, 25 → Mean = 18
- Salaries: 2000, 2500, 3000, 3500, 4000 → Mean = 3000
FAQs About the Mean Equation
What is the mean equation?
x̄ = ∑x / n
Can the mean be negative?
Yes, if the dataset has negative numbers.
Where is the mean used?
In statistics, class averages, business analysis, survey results, and Excel calculations.
What is the difference between mean, median, and mode?
Mean = sum ÷ count, median = middle value, mode = most frequent value.
Conclusion
The mean equation is an easy way to find the average of numbers. You can use it for a sample mean equation, population mean equation, weighted mean, geometric mean, or harmonic mean. Learning the mean in statistics helps in school, work, and daily life.
Tools like mean equation Excel make calculating the mean fast and simple. Knowing the standard error of mean equation and variance helps make results correct.
Practicing the mean equation step by step and solving sample mean equation examples makes you confident. It also helps you get the right answer in any math or statistics problem.
Click Here To Read About: What Does Hibachi Mean? Hibachi Cooking & Restaurants

I am Clara Lexis, a writer driven by clarity, depth, and authenticity. My focus is on transforming ideas into meaningful content that is both informative and engaging. I write with intention to communicate clearly, thoughtfully, and with purpose.